This website uses cookies so that we can provide you with the best user experience possible. Cookie information is stored in your browser and performs functions such as recognising you when you return to our website and helping our team to understand which sections of the website you find most interesting and useful.
IoT System for Forage Production Monitoring
Background
Public and private investors, as well as farmers themselves, are investing in the digitalization of agriculture to increase the profitability and sustainability of the agricultural sector.
Technological innovation is a major contributor to the transformation of the agricultural sector. Through the implementation of digital technologies, farmers manage resources more efficiently. Moreover, data processing using modern software solutions allows agricultural workers to focus on urgent tasks.
Request
The Canadian company's request was to develop an HMI application to communicate with devices located on agricultural machinery and warehouses.
The application should provide the user access to all the functions of sensors, dryers, and flow meters in a single interface for centralized management.
- Dryer remote control.
- Temperature control in warehouses.
- Hay solution consumption monitoring.
- Calculation of the number of hay bales and tracking their geolocation.
- Yield maps formation and storage.
The app should be compatible with iOS and Android. The data should be stored locally in the device's memory and then transferred to servers for secure storage. Thus, data has to be available at any time.
The application we developed had to perform several tasks.
1. Providing data from measuring instruments located on agricultural machines.
The client has measuring devices installed on agricultural machines. The functions of the measuring instruments are as follows:
- Bale tracking
Gadgets count the collected hay bales and provide data on their geolocation while harvesters are working in the field.
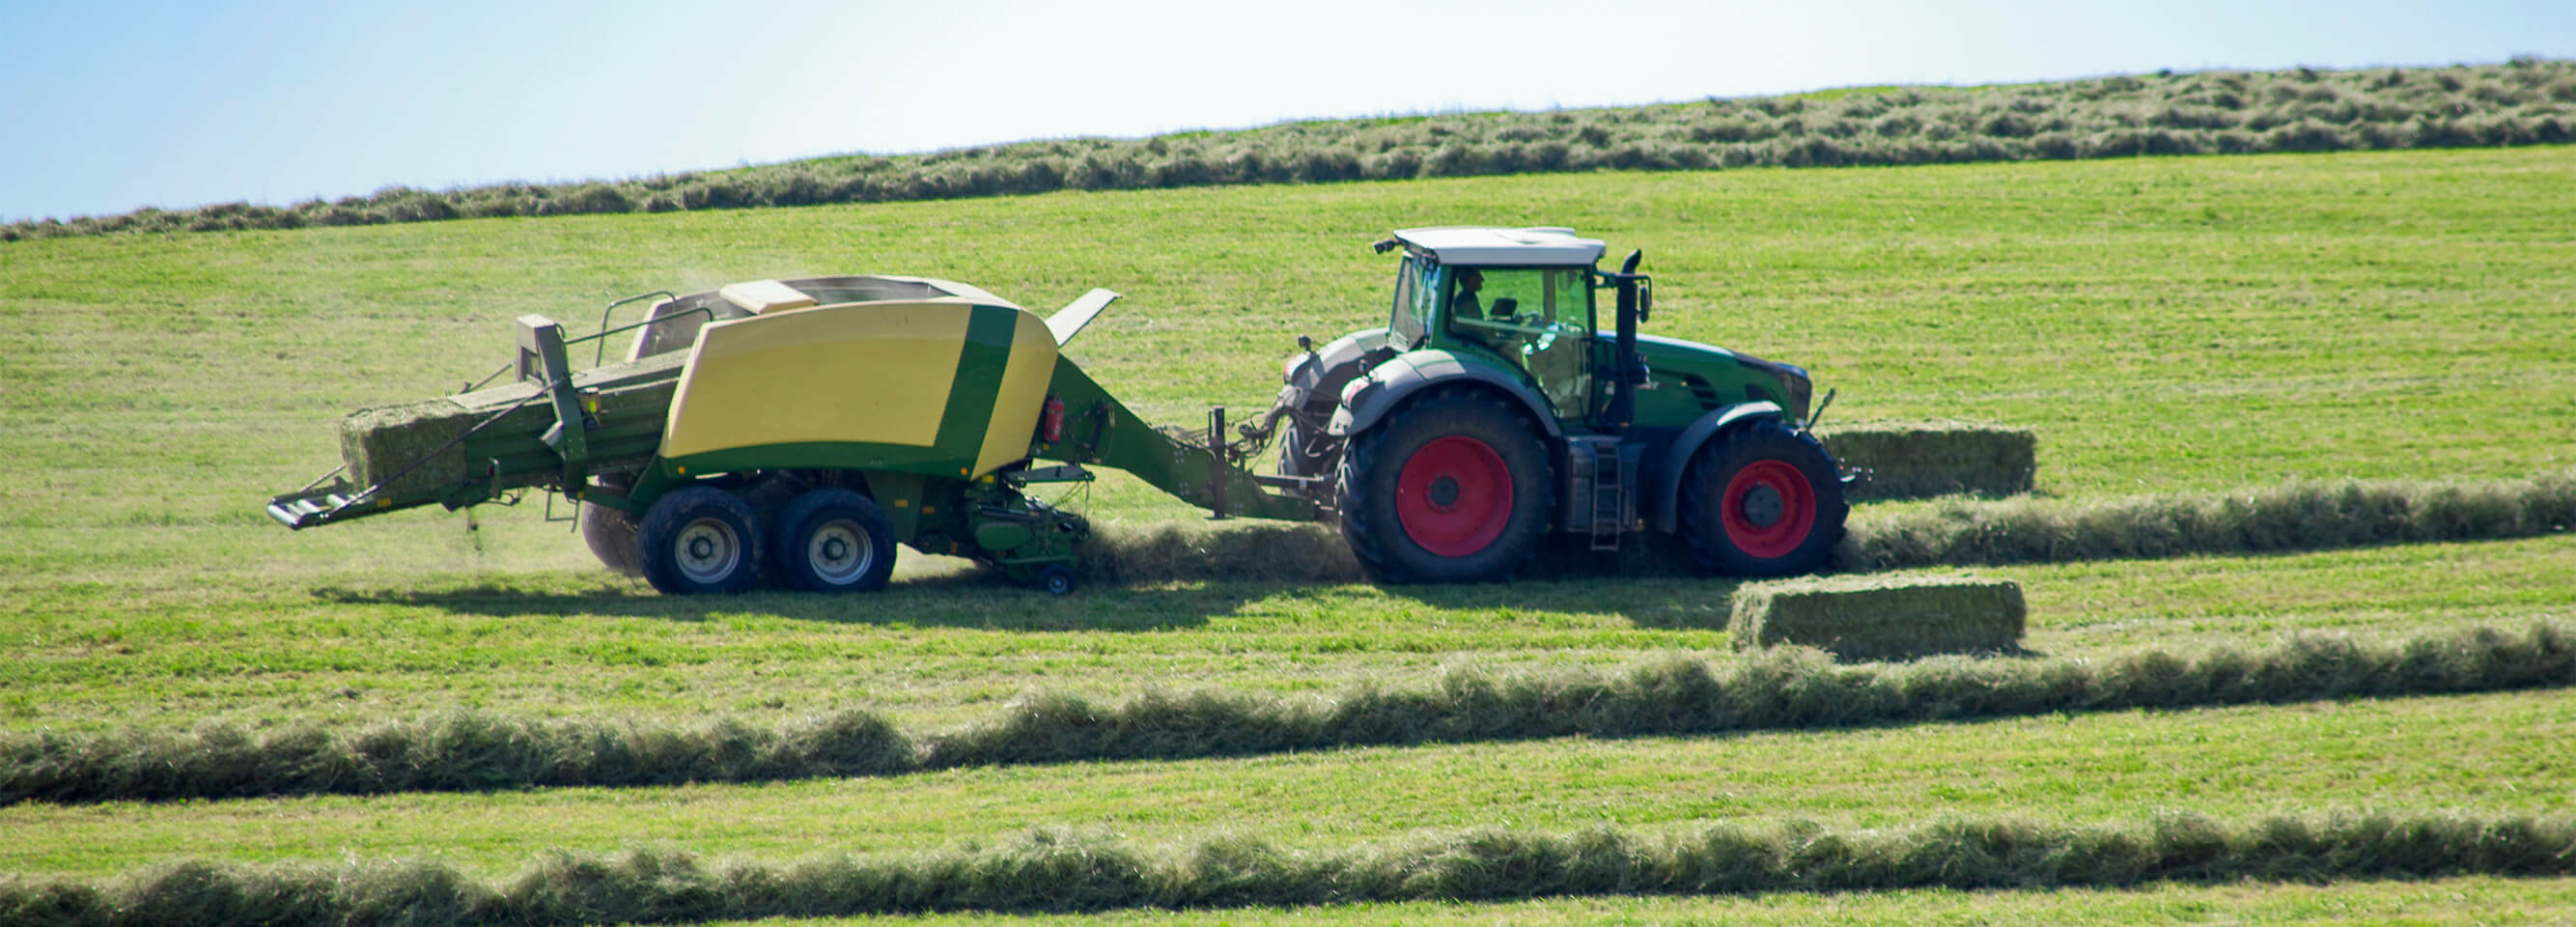
With a sensor mounted on the hay baler, each bale is counted to give the farmer an accurate picture of field performance.
The application saves the hay bale GPS coordinates transmitted by sensors, displays them on the map, and shows yield calculations.
- Flow meter monitoring
The flow meters measure the exact amount of hay solution used, while the app should calculate and display real-time flow rates in liters per hour, liters per ton, and per bale.
The use of flow meters in agriculture increases productivity and simplifies production control.
BLE technology connects the device to a mobile gadget (a smartphone or a tablet). The data is stored in a database provided by Amazon Web Services for further analysis.
2. Display of data from the built-in temperature control system in the forage storage
The sensors located in the warehouse next to the hay bales transmit the forage temperature data via LoRaWAN to the AWS server.
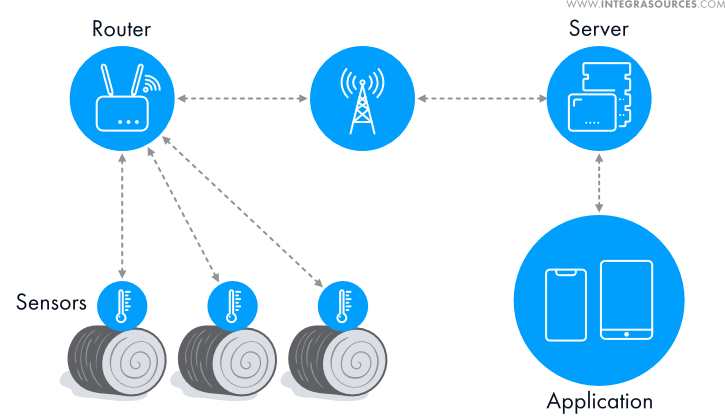
An easy-to-use application displays the temperature of the hay bales in real time. It sends alerts to the user when there are abnormal temperature changes. It also provides weekly reports with graphs for better traceability.
Having an idea of the current temperature in the warehouses, the farmer can maintain the silage quality at the right level as well as prevent the risk of fire.
3. Monitoring and control of dryers
The third task of the application is to control the operation of dryers, which are sealed chambers with uniform airflow and sensors for temperature, relative humidity, and static pressure. Based on the Raspberry Pi, the controller turns on hot air and pest control gas.
The application displays a list of registered dryers, completed drying stages, and various programmed batches. The farmer can remotely start or stop the dryer.
The application allows the user to monitor and change the drying and cooling time, and control static pressure, drying speed, temperature, outdoor humidity, hot air, and humid air on the screen of his device.
Temperature, humidity, pressure, and gas supply sensors installed inside the drying chamber capture the data displayed in the application using BLE and mobile Internet technologies.
The connection method is selected automatically depending on the physical distance from the dryer.
4. Provision of statistical information
The application provides statistics on the number of hay bales produced and the amount of hay solution applied to each field, with location and date.
The user can view the data saved on the map and determine the GPS position of hay bales in the fields for accurate monitoring.
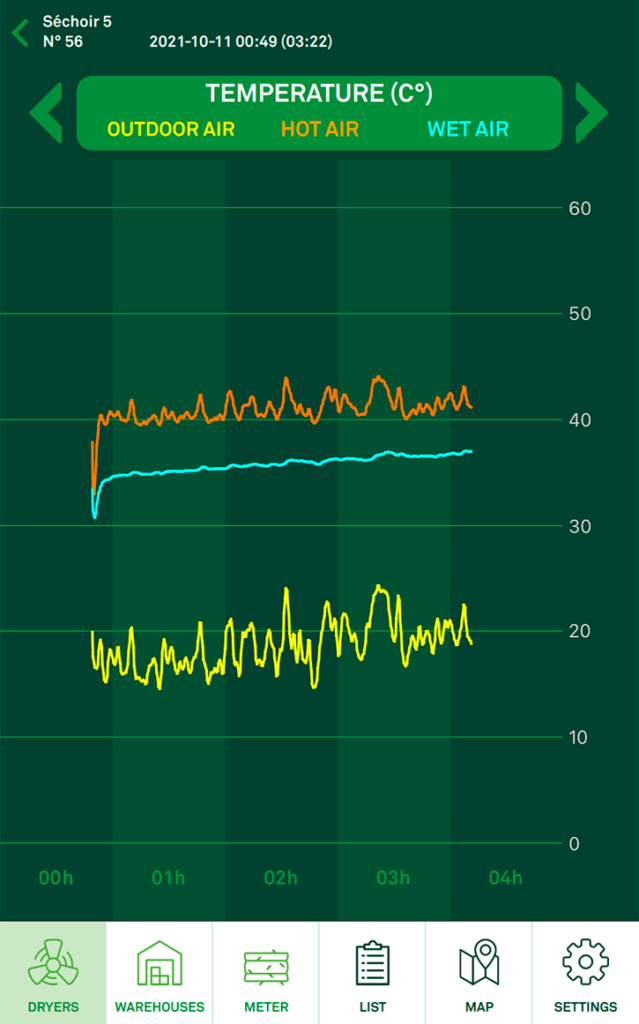
We have built a Qt application for iOS and Android to collect and display information from meters, sensors, and dryers.
Major Issues Resolved
The client had a Qt application for the HMI screen to control the hay dryers. The screen with the Raspberry Pi processor located near the warehouse was supposed to use a wired connection to monitor the equipment.
With the screen always on, the processor overheated, and the case temperature rose. It turned out that this was a feature of graphical interfaces created with the Qt framework. Complex animation that is constantly present on the screen consumes a lot of CPU resources. The device was, therefore, under maximum load all the time.
Our programmers have refactored the Qt user interface to avoid further device overheating. Later, the client decided to abandon the idea of the HMI screen. Instead, we have created a convenient mobile cross-platform application.
Using the Qt framework, we have created an application for iOS and Android from scratch. The slow operation of the Raspberry Pi with the database while processing temperature sensor data was also a small challenge. Our developers have added optimizations and come up with more convenient algorithms. In particular, data filtering has been included for a more visual display of graphs.
We have added a Kalman filter or linear-quadratic estimation to solve problems with determining the GPS coordinates and position of bales on the map.
The Scope of Work
- Android application development for flow meters
- LoRa sensor monitoring system development
- QML UI refactoring
- Cross-platform BLE-enabled application development
Technologies Used
- We wrote the application using C++, QML, and JavaScript.
- The Qt framework is used for cross-platform application development.
- We used a fast NoSQL database, Amazon DynamoDB, for data storage.
- Amazon Cognito makes it possible to add user registration, login, and mobile application access control.
- We used Amazon Web Services such as AWS Lambda, Amazon SNS, and AWS IAM to store and process data.
Result
Integra Sources has developed a complete IoT system that collects and transmits data via BLE and stores it in the local database.
We improved the logic and ensured the interaction of dryers with cloud services.
Integra has developed intuitive user interfaces for a mobile application to interact with flow meters, dryers, and warehouse monitoring systems.
Now we are working on the continuation of the project. At the client's request, we will add automatic detection of the position of the field on which the hay baler is working at the moment. The app will immediately display location information on the gadget's screen before moving to the database for safe storage.
Currently, we are also working on the possibility of choosing connected devices - with and without a bale counter.
You might also like...
Industrial Gas Burner Controller
A supplier of industrial automation solutions asked Integra Sources to design a controller for industrial gas burners capable of competing with products from leading market players.
LEARN MORE
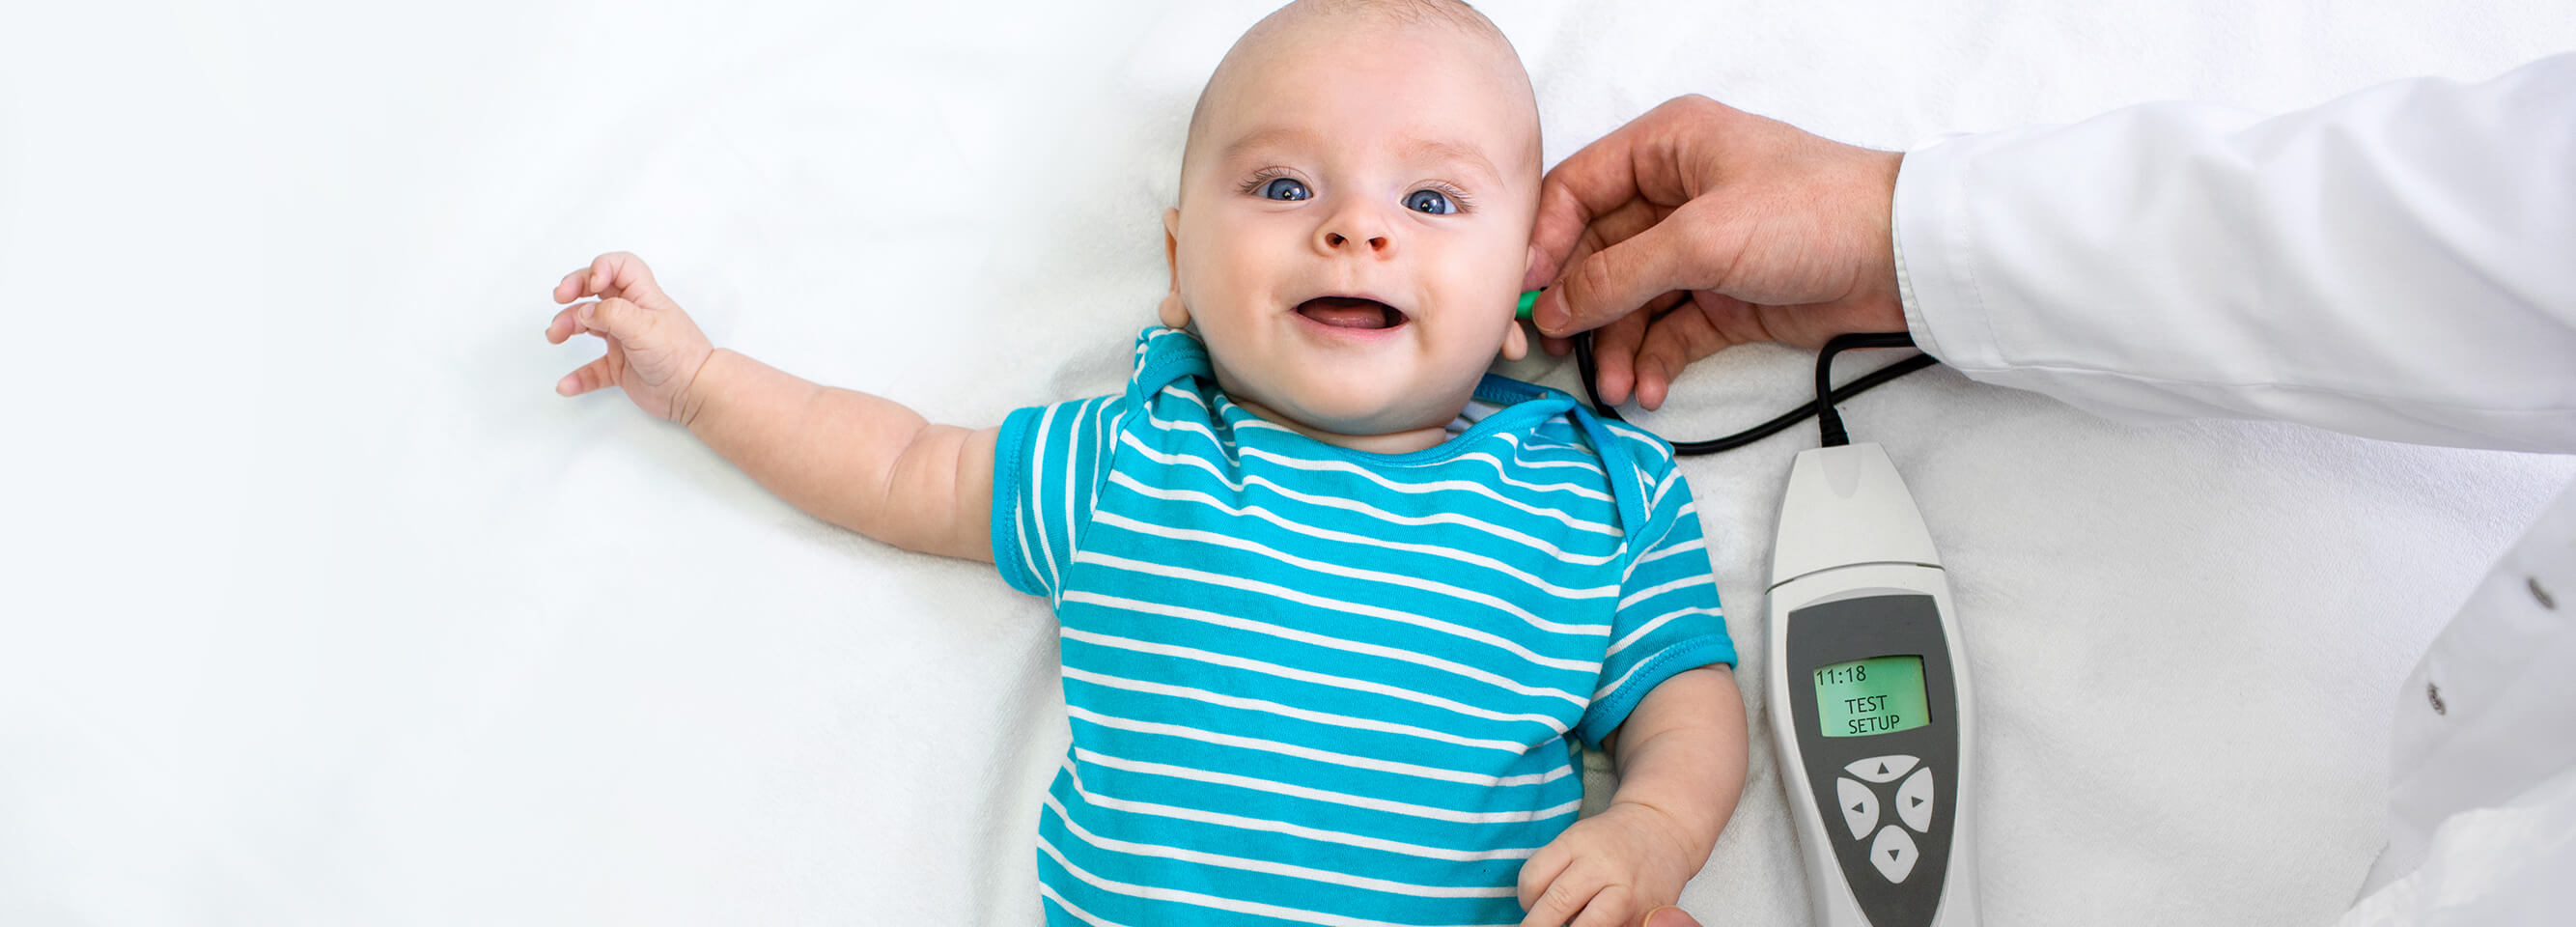
Otoacoustic Emission System
With its advanced probe, the system captures two types of otoacoustic emissions: TEOAE and DPOAE. Results are saved directly to the device’s memory and can be printed via a connected thermal printer.
LEARN MORE


